The Geneious Microsatellite Plugin can analyze microsatellite traces from ABI fragment analysis machines. This guide covers how to view traces, call ladders, call peaks, predict bins and display alleles in tabular format.
To install the Microsatellite Plugin you must be using Geneious R7 or later. You can install the plugin from the Plugins menu in Geneious, or by downloading from our plugins page and dragging the .gplugin file into Geneious.
Import your data and view traces
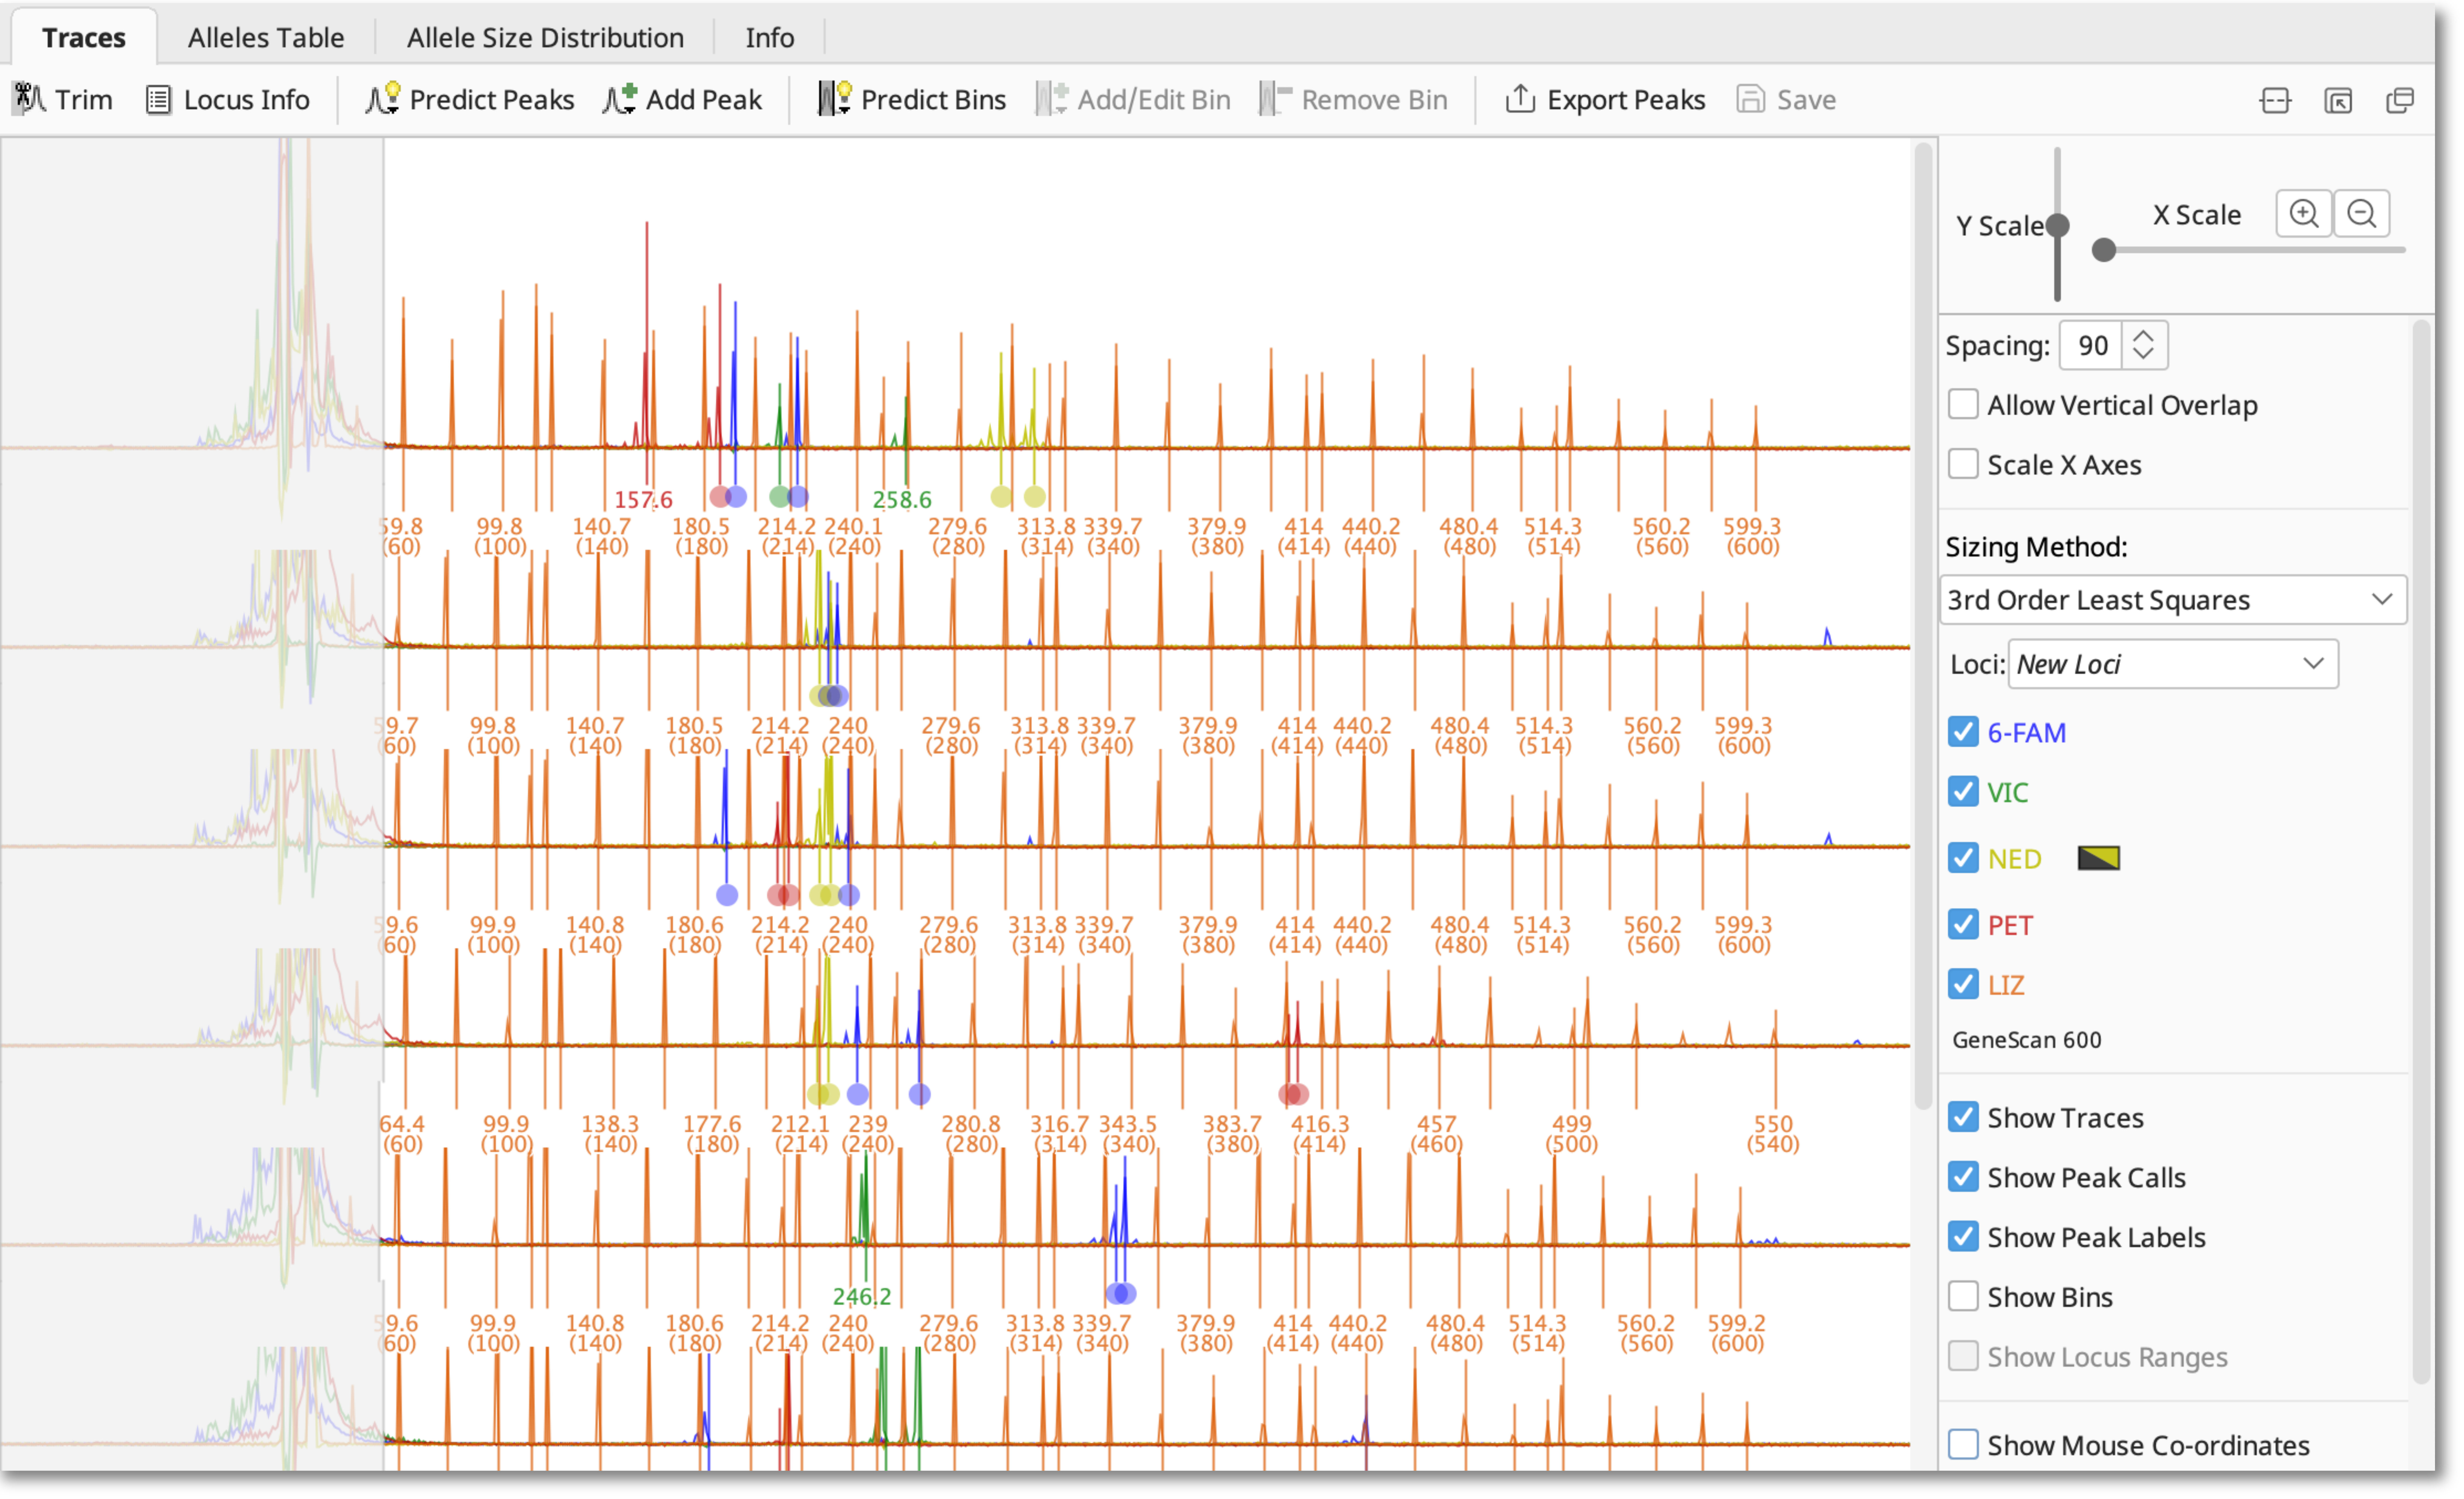
Import your .fsa files by either dragging and dropping them into Geneious, or using Import → from Multiple Files under the File menu. Traces that are selected will be shown in the viewer.

The controls to the right of the viewer allow you to zoom in and out on the traces, control which dyes are displayed, and view peak labels, peak calls and bins.
Check your ladders
Geneious will use the distance between ladder peaks to determine which ladder you have used. The ladder must be in the last dye on the trace, otherwise it will not be recognised. However, sometimes you need to edit the ladders peaks before the correct ladder can be called. This post describes what to do if Geneious doesn’t recognise your ladder.
At this stage you should also set your sizing method - this is the algorithm used to convert x coordinates from the trace into base pairs. 3rd Order Least Squares or Local Southern are the recommended algorithms.
Set your loci
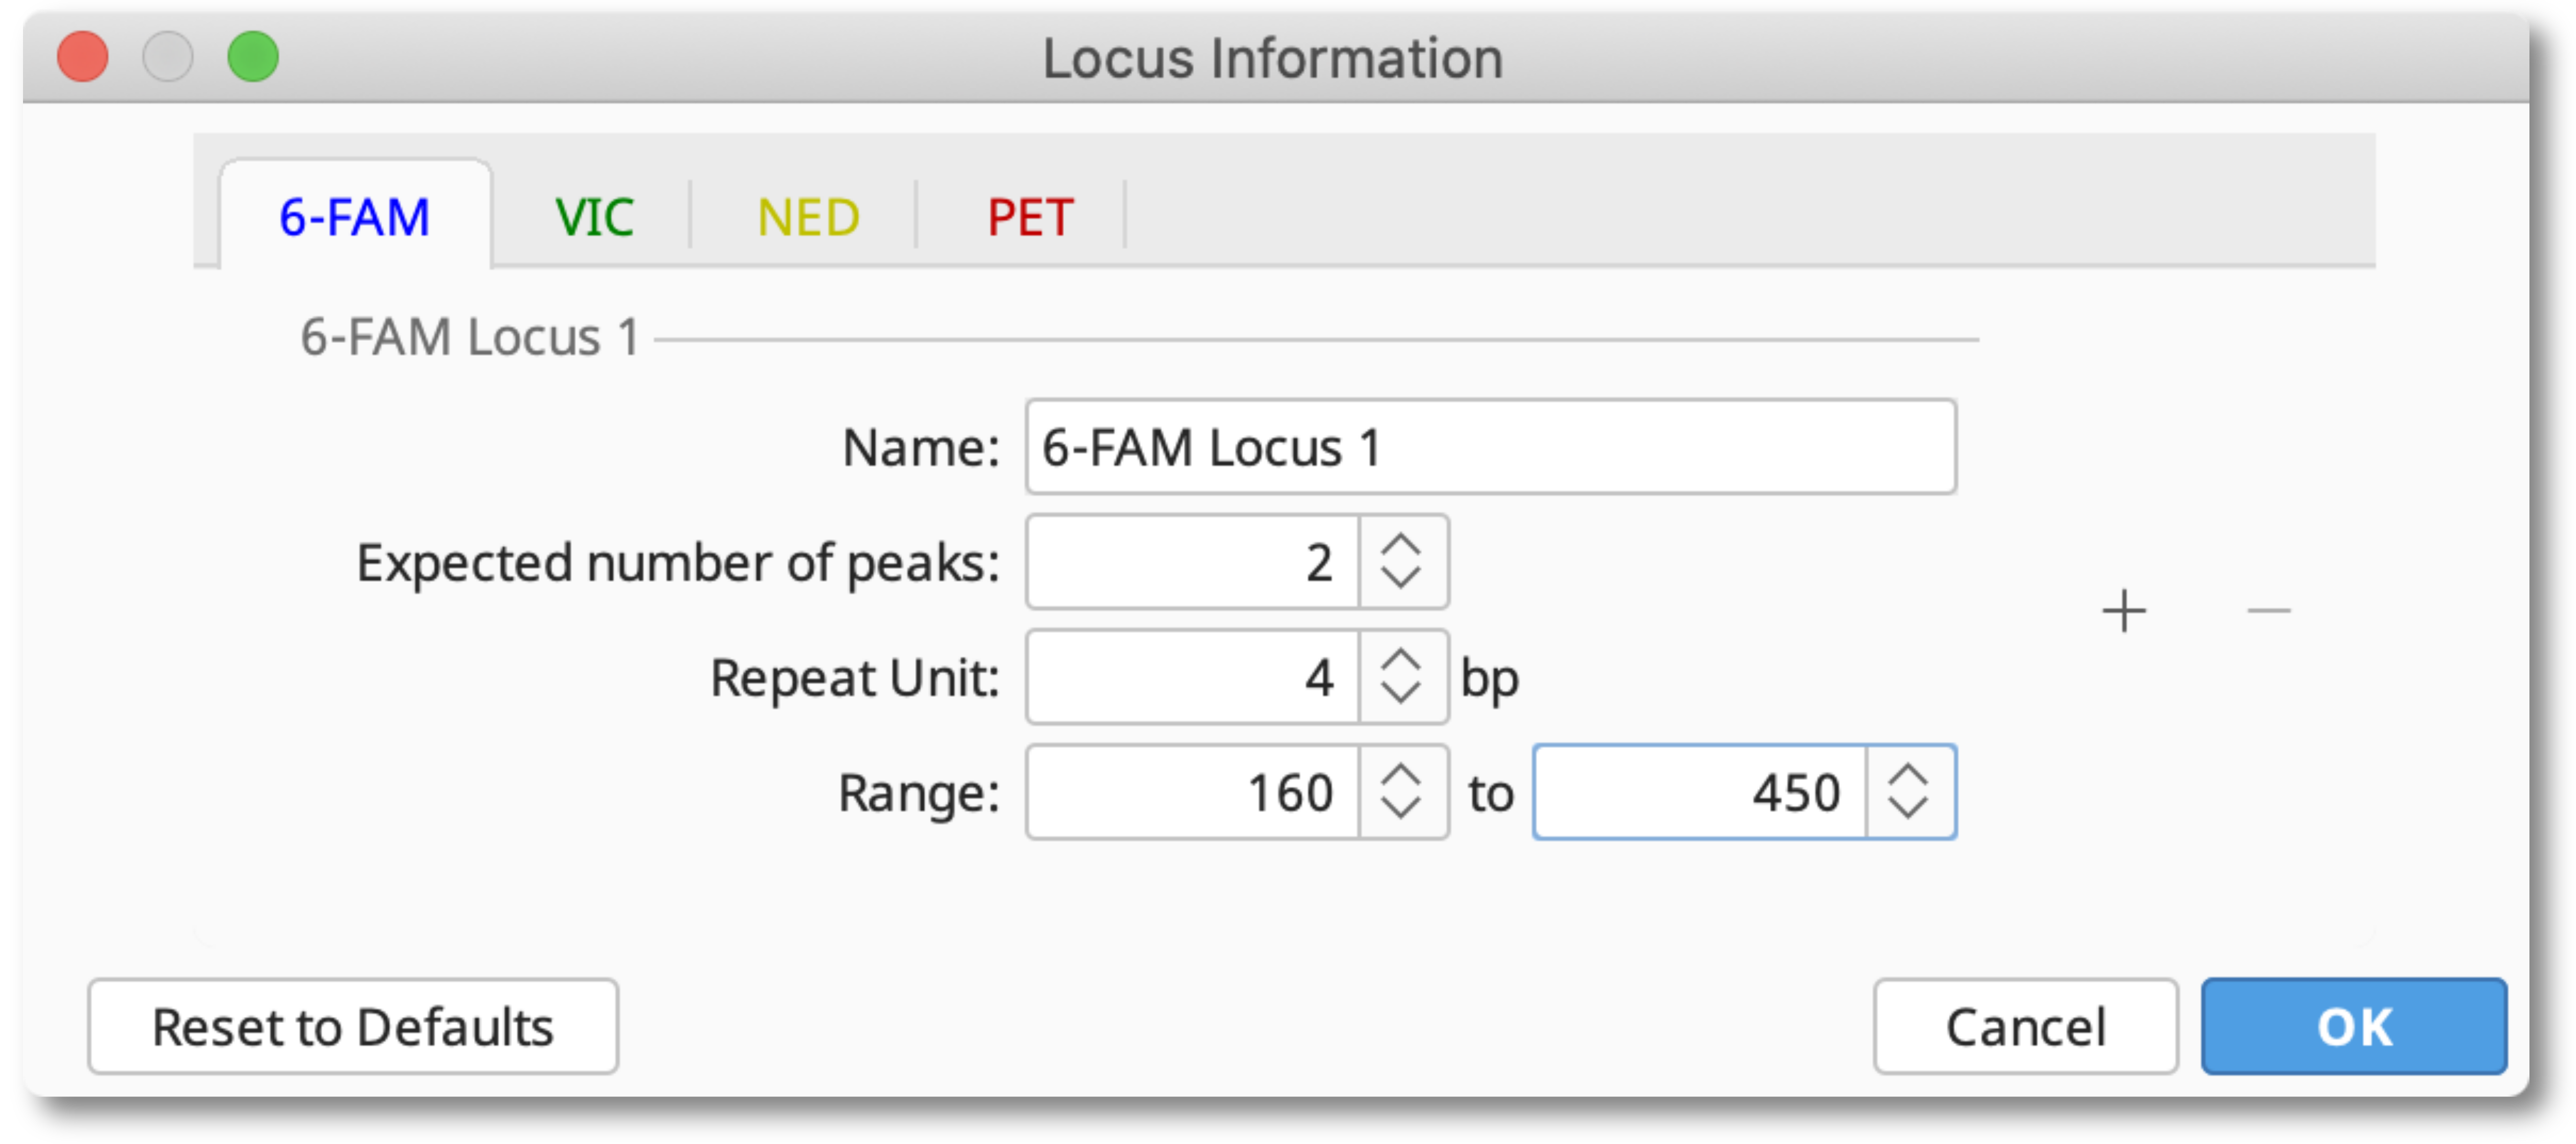
Set up your locus document by selecting all your traces and clicking Locus Info.

Enter your repeat unit and PCR product size range for each dye. If you are working on a diploid organism, the expected number of peaks should be 2. For polyploid organisms you can increase this number to the number of homologous chromosomes your organism has. When you are finished entering this information, click OK, then Save and give your locus document a name.
You should then see your locus document appear in the document table, and it will automatically be applied to all selected traces. If you want to apply an existing locus document to a new set of traces, select your traces and choose the locus document from the “Loci” dropdown menu to the right of the viewer.
Check your peaks
At this stage it is a good idea to check for any stutter peaks or incorrectly called peaks and remove them.
Predict Bins
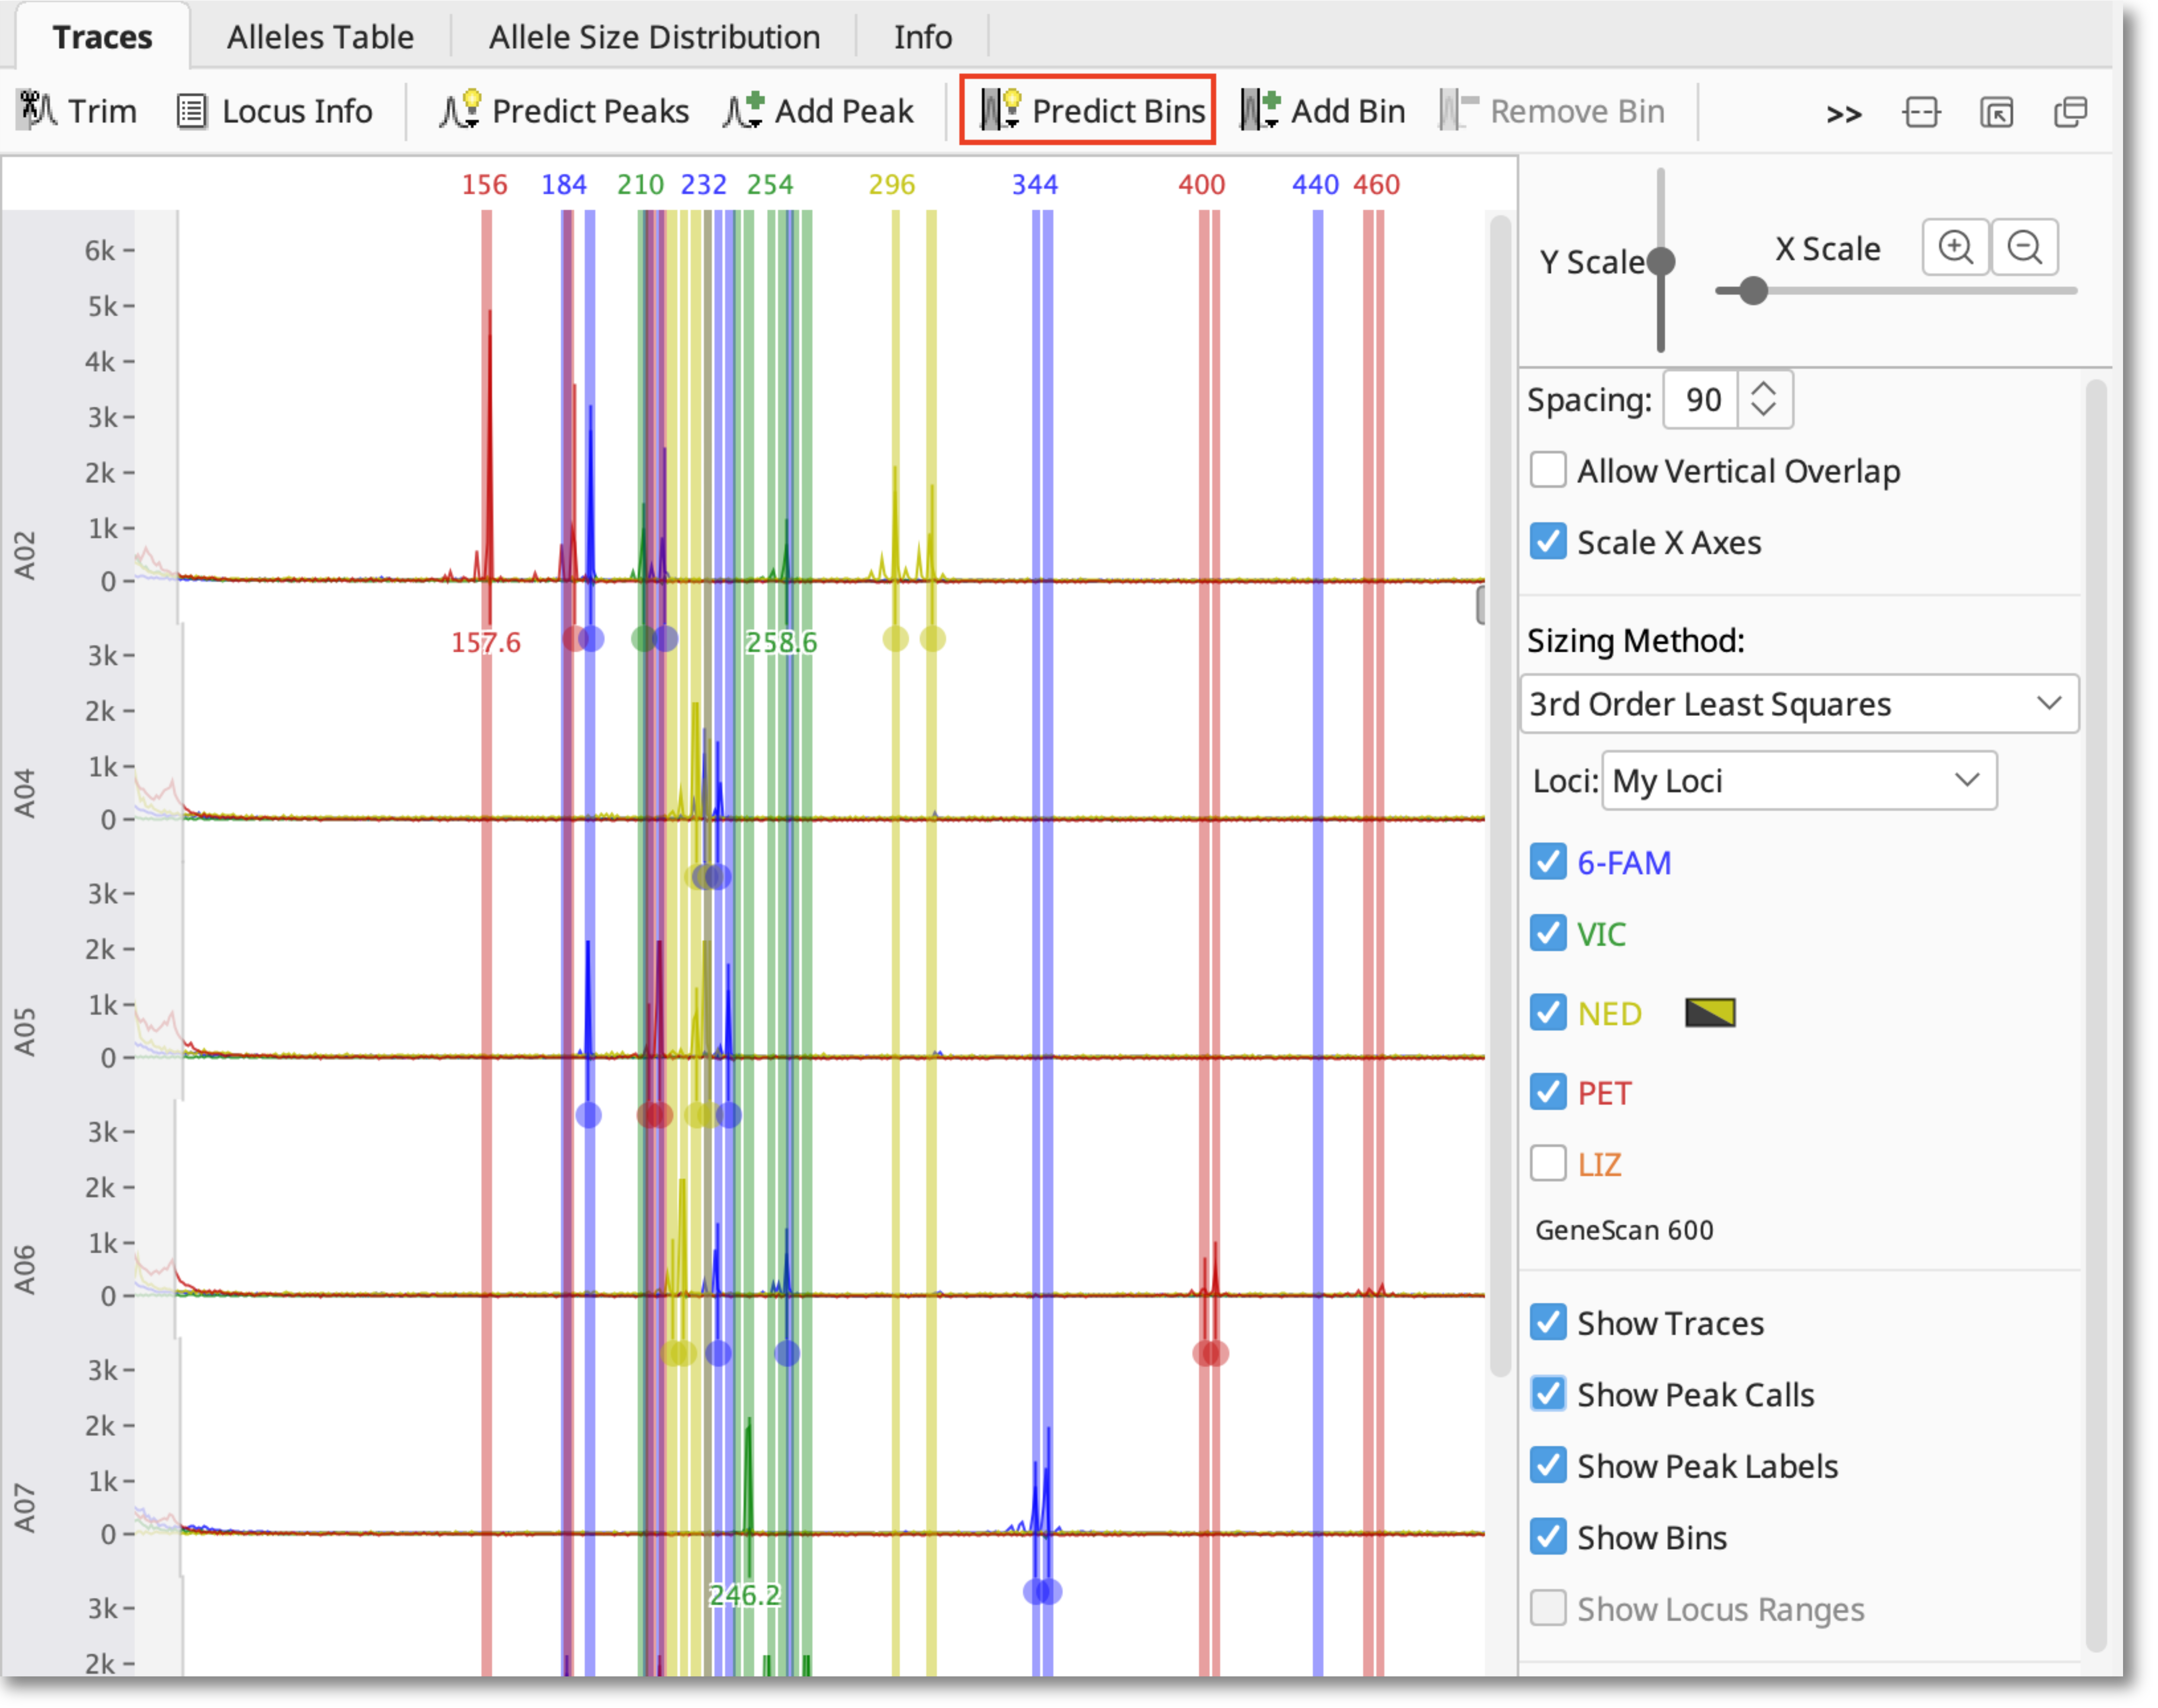
To create bins based on the size of the observed peaks, click Predict Bins and select each dye you have used. If you wish, you can specify an “example allele” to anchor the bin to. Binning sorts the peaks into allele sizes based on the repeat unit information you’ve provided in the locus document, allowing you to account for small variations between samples.

View and export the results
Select the Alleles Table to view your alleles in tabular format. The alleles table shows the binned allele size for each allele, or a warning if there are no peaks or peaks falling outside the bins.

The “no peaks” warning generally means that no product was amplified in that sample.
If you have unbinned peaks that are just outside the bin boundary, go to the affected trace document and turn on just the dye that has the unbinned peak. Select the bin the peak should be in and choose Edit Bin and extend the range, or just drag the bin to include the peak. If a peak is well outside the bin boundary you may need to consider whether the peak is called correctly.
When you are happy with your allele calls, you can export the Alleles table in .csv format by clicking the Export table button.